KINGAROY RAINFALL

2010


Official
readings for Kingaroy are taken at the Kingaroy Airport.

 94549  -  KINGAROY AIRPORT  -  151.8398°E, 26.5737°S, 434m ASL


KINGAROY Town  -  151.5072°E, 26.3232°S, 437m ASL

The rainfall ( in mm ) reported here is read from a commercial rain gauge mounted in the open on a post 2 metres off the ground at our home in Kingaroy itself, some 5km from the Kingaroy Airport.


Here is a link to our States' water resources. 

(The Dam closest to our area is the Bjelke-Petersen Dam

Water Storage Information


(1)

6th March 2010 - 12.45pm

Stuart River Bridge (Kelvyn T Peters Bridge) - On the way to the Kingaroy rubbish dump.
 

Click on the pictures for larger versions 


6th March 2010 - 4.00pm

Embreys Bridge - Barkers Creek - Kingaroy / Nanango Road


(2)

13th March 2010

Cyclones Ului and Tomas in the Coral Sea being watched as they head generally towards Australia.


Thanks to NESDIS Satellite Services Division

MTSAT IR Colorized Loop
http://www.goes.noaa.gov/sohemi/sohemiloops/shirgmscol.html

Click on the picture for a larger version


( 3-13-2010 1230Z )

13th March 2010 - 10.30pm Eastern Standard Time - Australia


( 3-13-2010 2030Z )

14th March 2010 - 6.30pm Eastern Standard Time - Australia


RSMC Nadi Tropical Cyclone Warning Centre


TROPICAL CYCLONE THREAT TRACK MAP

Severe Tropical Cyclone ULUI Category 3

Tropical Cyclone Warning Number 19 issued 1403 UTC Saturday 13 March 2010


Note: the past cyclone track may be adjusted on the basis of later information. The forecast track is considered the most likely based on the information available at time of analysis, and there may be other possible future tracks.

 
   Warning: Gales or stronger within 24 hours          Very Destructive Hurricane Force Winds
   Alert: Gales or stronger within 24-48 hours          Destructive Storm Force Winds
                Damaging Gale Force Winds
For the 24 hr and 48 hr positions, the three radii represent the extent of Hurricane, Storm and Gale winds away from the centre.

 
Name:       Severe Tropical Cyclone ULUI
Situation At:       1200 UTC Saturday 13 March 2010
Location:       13.1S, 163.0E
Recent Movement:       WNW at 17 km/h


Fiji time is UTC +12 hours.
For example, 0000 UTC Saturday is 1200 Saturday Fiji time.
For example, 1800 UTC Saturday is 0600 Sunday Fiji time.

Category Cyclone 1 has mean winds 34-47 knots with a central pressure greater than 985 hPa
Category Cyclone 2 has mean winds 48-63 knots with a central pressure 985-970 hPa
Category Cyclone 3 has mean winds 64-85 knots with a central pressure 970-945 hPa
Category Cyclone 4 has mean winds 86-107 knots with a central pressure 945-910 hPa
Category Cyclone 5 has mean winds greater than 107 knots with a central pressure less than 910 hPa


RSMC Nadi Tropical Cyclone Warning Centre


TROPICAL CYCLONE THREAT TRACK MAP

Severe Tropical Cyclone ULUI Category 4

Tropical Cyclone Warning Number 21 issued 2054 UTC Saturday 13 March 2010


Note: the past cyclone track may be adjusted on the basis of later information. The forecast track is considered the most likely based on the information available at time of analysis, and there may be other possible future tracks.

 
   Warning: Gales or stronger within 24 hours          Very Destructive Hurricane Force Winds
   Alert: Gales or stronger within 24-48 hours          Destructive Storm Force Winds
                Damaging Gale Force Winds
For the 24 hr and 48 hr positions, the three radii represent the extent of Hurricane, Storm and Gale winds away from the centre.

 
Name:       Severe Tropical Cyclone ULUI
Situation At:       1800 UTC Saturday 13 March 2010
Location:       13.0S, 162.4E
Recent Movement:       W at 11 km/h


Fiji time is UTC +12 hours.
For example, 0000 UTC Saturday is 1200 Saturday Fiji time.
For example, 1800 UTC Saturday is 0600 Sunday Fiji time.

Category Cyclone 1 has mean winds 34-47 knots with a central pressure greater than 985 hPa
Category Cyclone 2 has mean winds 48-63 knots with a central pressure 985-970 hPa
Category Cyclone 3 has mean winds 64-85 knots with a central pressure 970-945 hPa
Category Cyclone 4 has mean winds 86-107 knots with a central pressure 945-910 hPa
Category Cyclone 5 has mean winds greater than 107 knots with a central pressure less than 910 hPa


(3)

( 3-16-2010 1930Z )

17th March 2010 - 5.30pm Eastern Standard Time - Australia


Queensland State Forecast

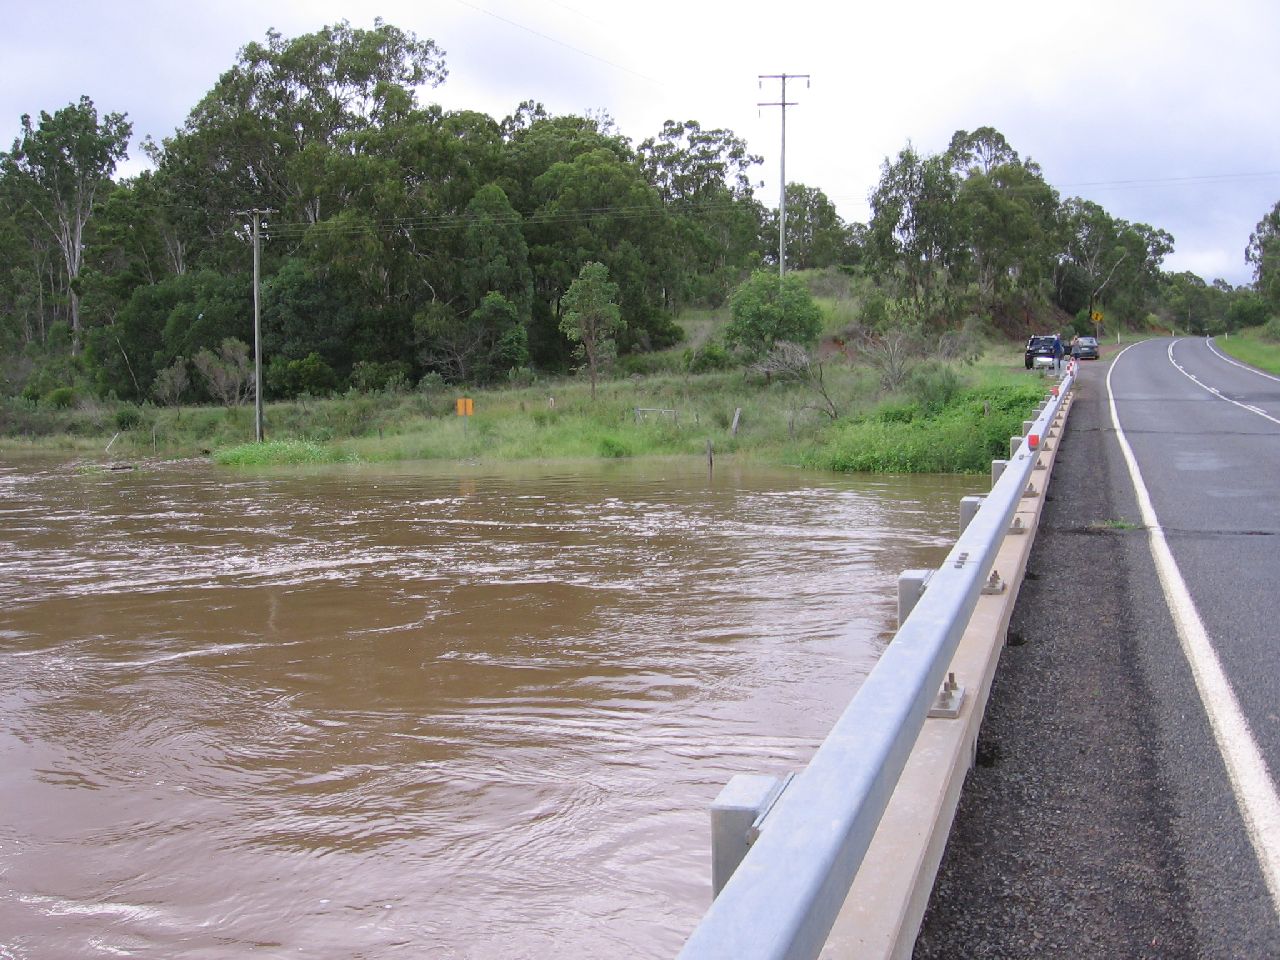
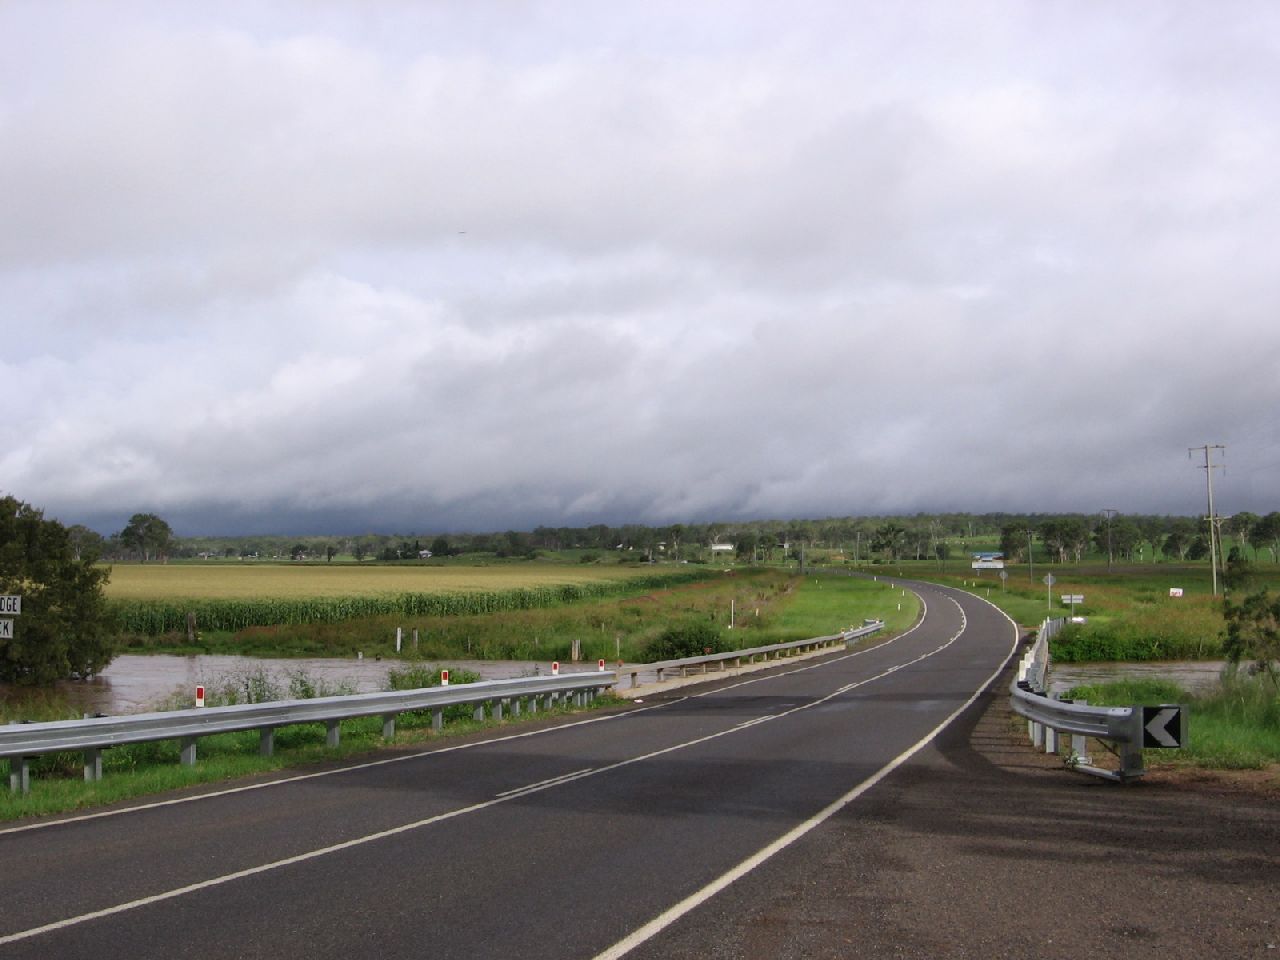
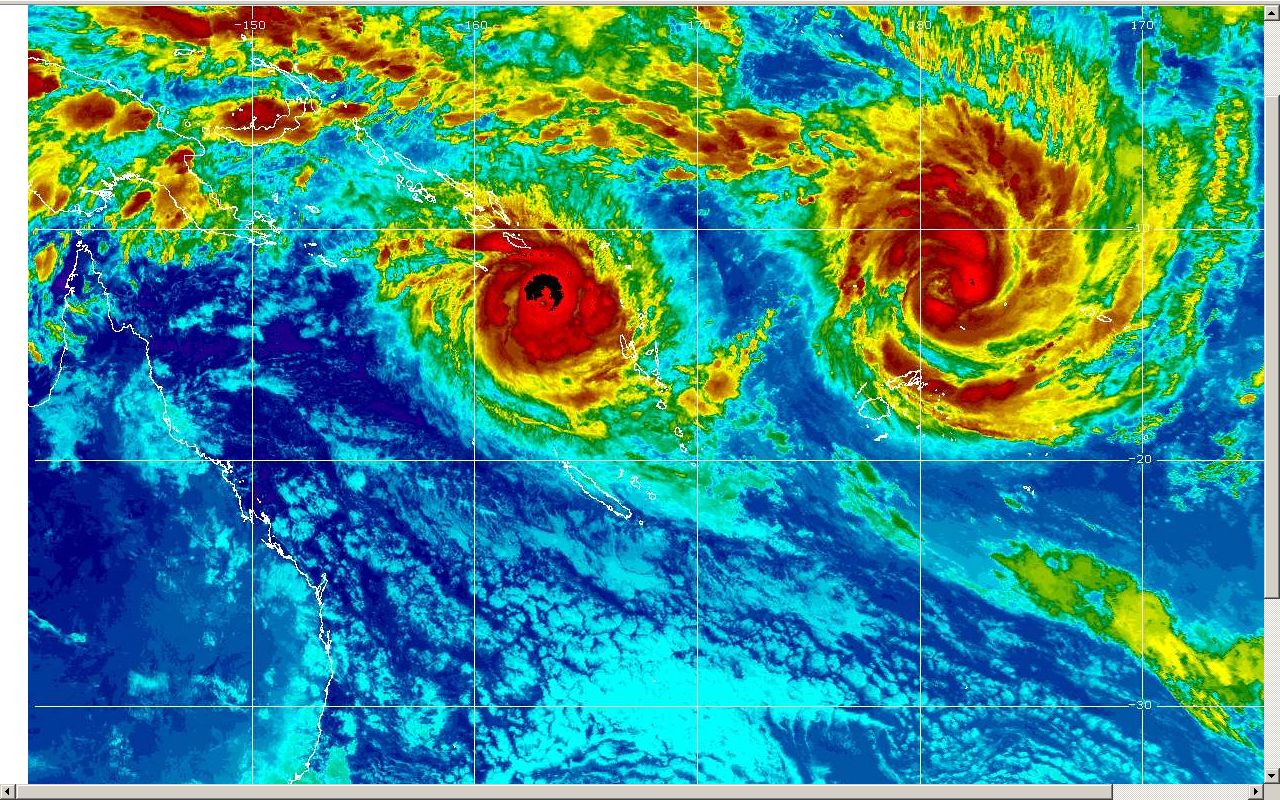
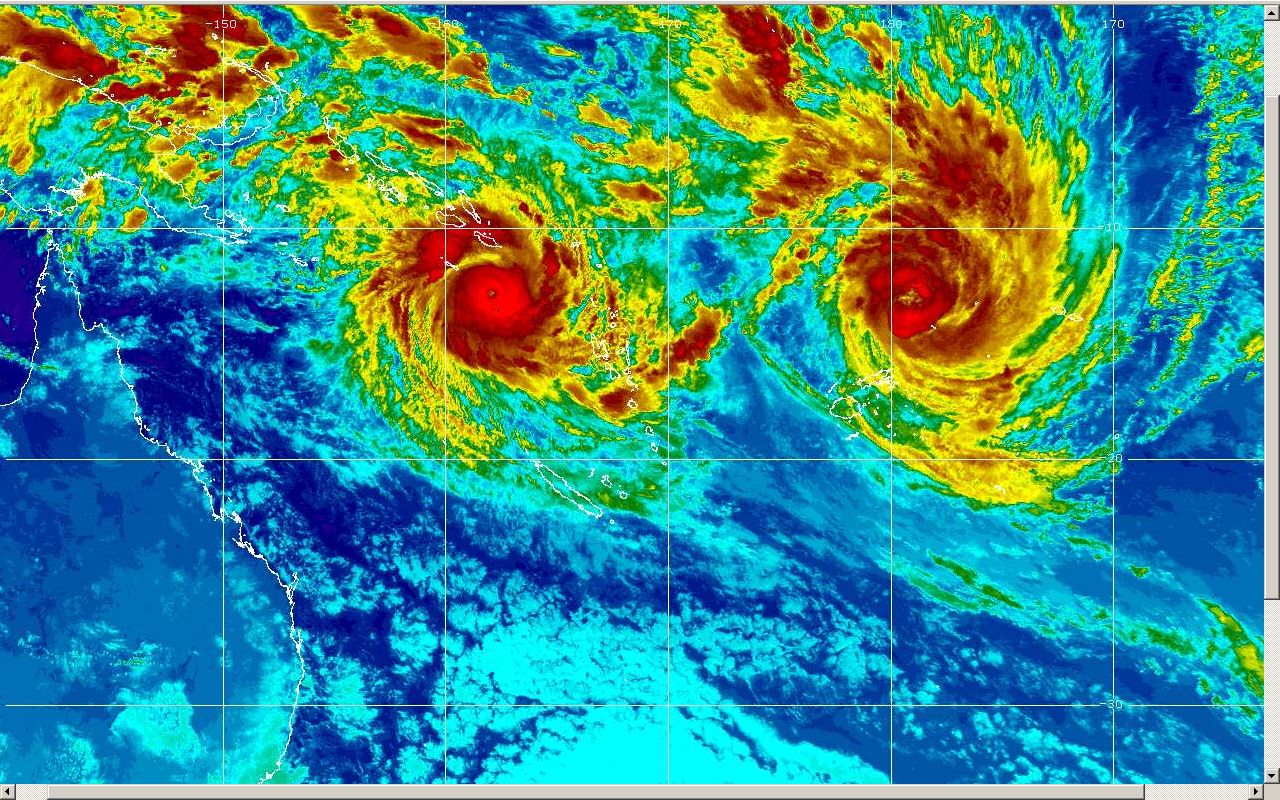
IDQ10700
Australian Government Bureau of Meteorology
Queensland

 
QUEENSLAND WEATHER FORECAST
Issued at 4:45am EST on Wednesday the 17th of March 2010

IDQ1070001
WARNING SUMMARY
Many rivers in southern Queensland are subject to flood warnings, refer to
latest warnings for individual rivers.  

A coastal waters wind warning is current for waters between Lockhart River and
Cape Moreton, including Hervey Bay. 

STATE FORECAST
for Wednesday
Scattered showers along the east coast, tending isolated over the adjacent
inland areas. Scattered showers and isolated thunderstorms through Torres
Strait. Fine and a little cool over the interior. Fresh to strong and gusty SE
winds along most of the east coast. Moderate to fresh E to SE winds elsewhere. 

IDQ1070002
EXTENDED OUTLOOK
The high pressure system over the Tasman Sea will remain near stationary into
the weekend. Severe Tropical Cyclone Ului is expected to maintain a southward
track over the next couple of days, well off the east Queensland coast. It
should maintain a similar [Category 4] intensity, although re-intensification to
category 5 is possible. 

On Friday the cyclone is expected to turn west-southwest and begin moving closer
to the Queensland coast. On current predictions the most likely scenario is for
the cyclone to impact the central Queensland coast sometime during the weekend.
The windy conditions over much of the Queensland east coastal waters will
continue due to the tight pressure gradient generated by a combination of a high
pressure system situated in the Tasman Sea and Severe Tropical Cyclone Ului.
However, as the cyclone moves south then west-southwest over the Coral Sea winds
are likely to ease over the far northern coast late in the week; while further
increasing about the central and southern Queensland coasts with increasing
swell in southern waters. A large swell is expected in southern waters during
the weekend. Refer to the latest forecasts and warnings for more detail.

In the meantime, scattered squally showers will continue in most east coast
districts, spilling over into adjacent inland areas mainly in the afternoon.
Isolated thunderstorms will continue near Torres Strait. Showers will tend to
clear about the north tropical coast by the weekend, while increasing to rain
with moderate to heavy falls about the central to southern coast during the
weekend as the cyclone nears the central Queensland coast.

In the absence of any forecast major weather systems to the west, most of the
Queensland interior will remain fine into the weekend with temperatures
generally a little below average.
067 
WTAU01 ABRF 161834
IDQ20008
PAN PAN
 
HIGH SEAS WEATHER WARNING FOR METAREA 10 ISSUED BY THE AUSTRALIAN BUREAU OF
METEOROLOGY, BRISBANE 1834 UTC 16 March 2010

HURRICANE FORCE WIND WARNING FOR NORTH EASTERN AREA

SITUATION
At 1800 UTC Severe Tropical Cyclone Ului was centred within 10 nautical miles of
 latitude thirteen decimal seven south [13.7S]
 longitude one hundred and fifty seven decimal eight east [157.8E]
Recent movement : south at 2 knots
Maximum winds   : 100 knots
Central pressure: 937 hPa
AREA AFFECTED
Within 180 nautical miles of the centre.

FORECAST
Maximum winds to 100 knots near the centre.

Winds above 64 knots within 45 nautical miles of centre with phenomenal seas.

Winds above 48 knots within 85 nautical miles of centre with high to very high
seas.
  
Winds above 34 knots within 180 nautical miles of centre with very rough seas.

Forecast positions
At 0600 UTC 17 March: Within 40 nautical miles of 14.2 south 157.9 east
                        Central pressure 938 hPa.
                        Winds to 100 knots
At 1800 UTC 17 March: Within 70 nautical miles of 14.9 south 158.2 east
                        Central pressure 938 hPa.
                        Winds to 100 knots
REMARKS
All ships in the area please send weather reports every three hours. Regular
weather observing ships use normal channels. Other ships please use either email
to marwxqld@bom.gov.au or fax to +61732398776 or satellite to SAC 1241 through
Land Earth Station Perth 212.
Next warning will be issued by 0100 UTC 17 March 2010.

WEATHER BRISBANE


(4)

1st April 2010

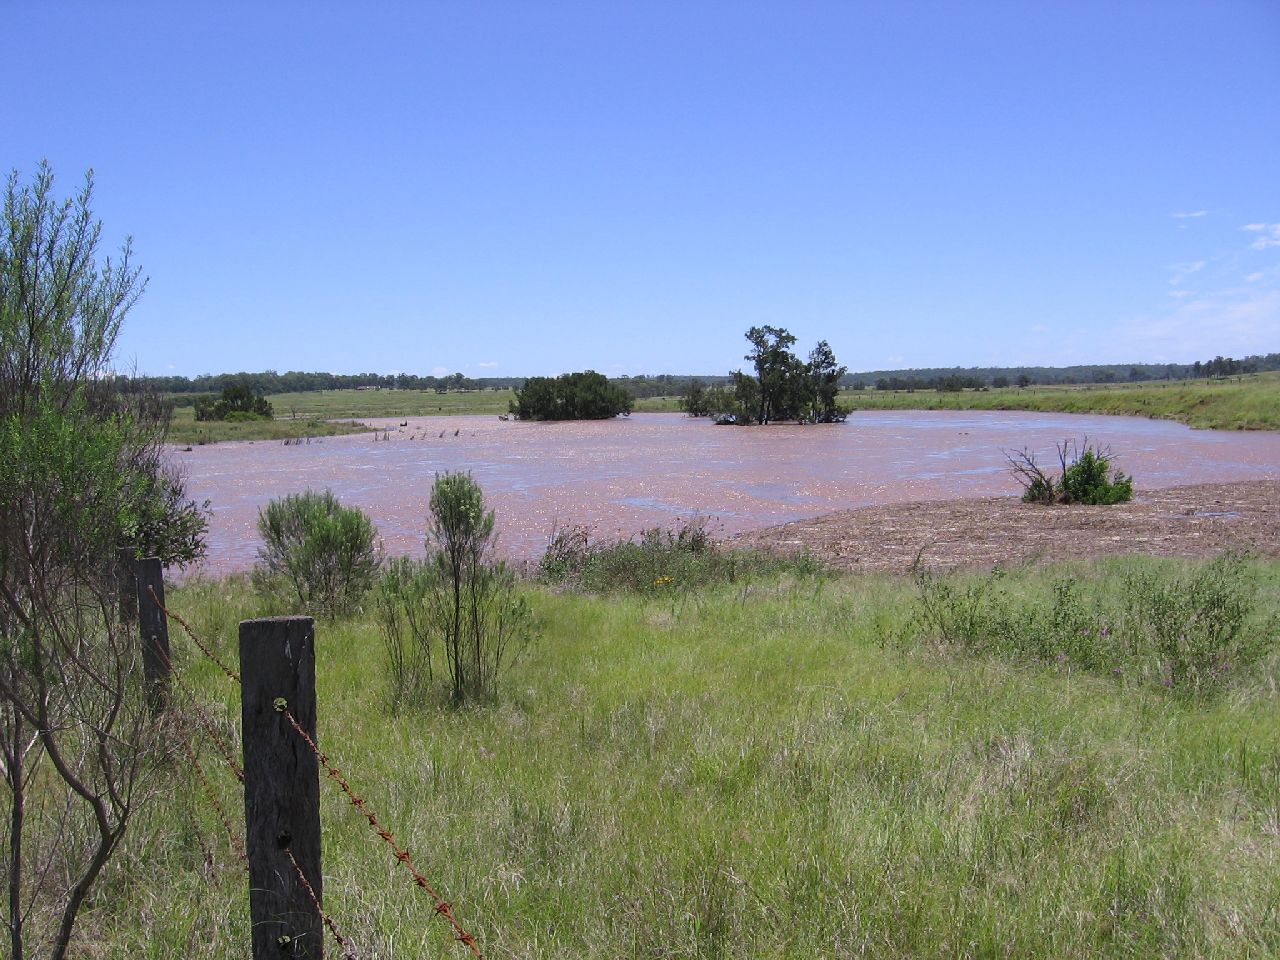
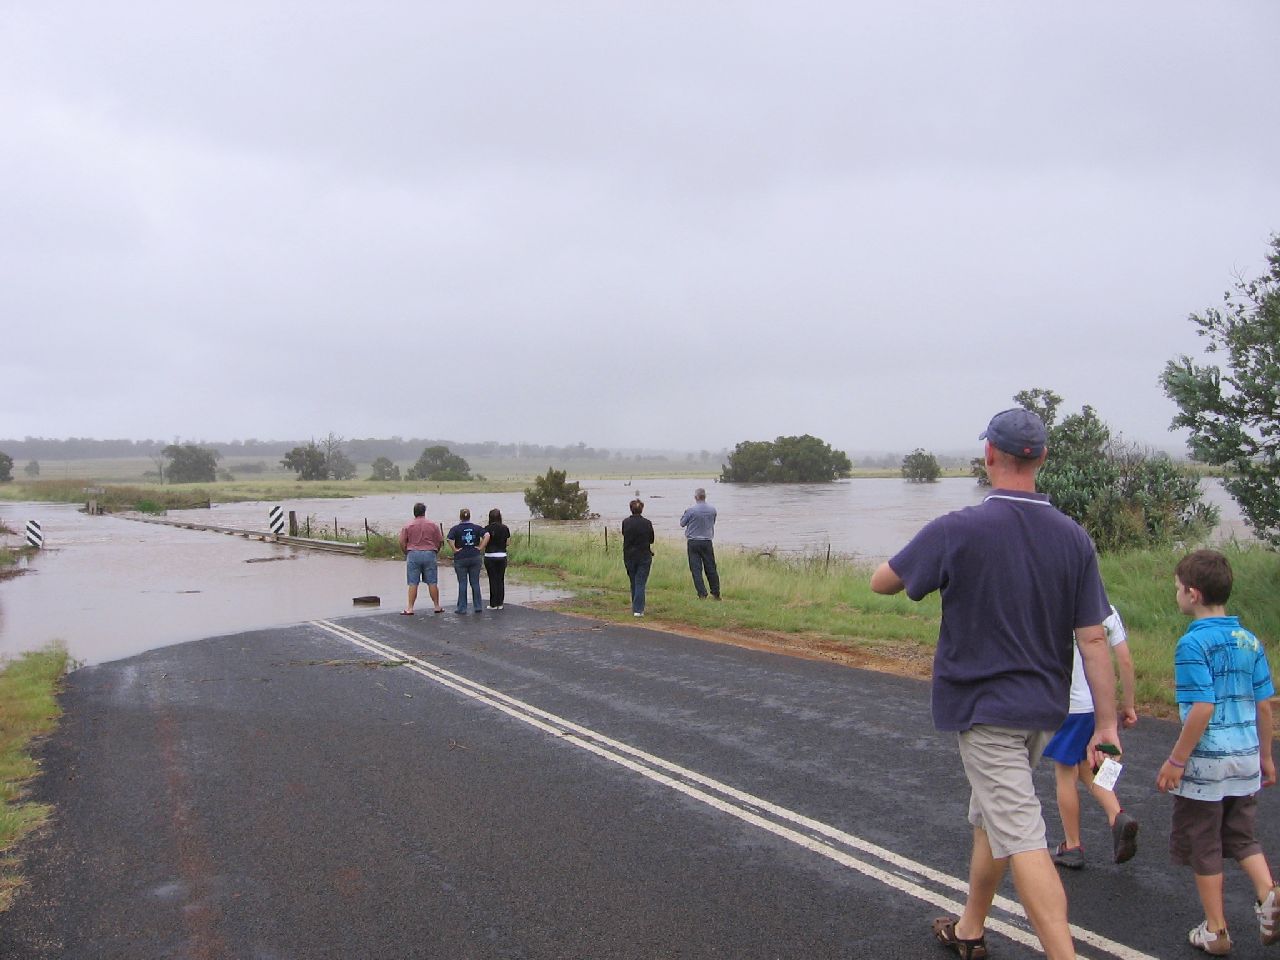
We reached the same figure as at October 2009. This year is, so far, a far better year rain wise.


(5) 

20th December 2010

We reached double the rainfall of 2009.

 
Stuart River Bridge (Kelvyn T Peters Bridge) - On the way to the Kingaroy rubbish dump.


Click on the pictures for larger versions


The back of the "rain event" as it headed northeast away from Kingaroy


Readings are taken at 9.00 am


Date Jan Feb Mar Apr May Jun Jul Aug Sept Oct Nov Dec
1 .5 46 .5 (4) 20

1


1

1

2 .5 13 58.5                 30
3     49      

5.5

        3
4 6   1                

3.5

5                

6.5

10


17

6     (1) 90          

60


8

4

7     14                  
8 28 8.5 12            

4


3.5

9 2.5   2            

39


3

10              

1.5

       
11     4        

59

10.5

9.5

   
12       12

2.5


12


51

13     (2) 3            

.5

 
14                        
15          

1


1.5


2

 
16   20              

28

   
17   2.5 (3)                

61

18 2.5 10    

3.5


1.5


1

19          

1.5


1.5


6.5

19

20            

5

18

9


(5) 74

21        

1


9.5

15

     
22   1.5   1.5                
23                    

5.5

29

24              

13


11

25        

14


2

1.5


4

26              

3.5


19

27                      

50

28   1                  

26

29     5  

8


7.5


27


6

30 28   1    

5.5


2.5

 
31                        
Monthly Totals 68 102.5 237 36.5

30

8

18

104.5

134.5

104

26

416
Days Rained 7 8 11 4

6

3

3

6

10

7

7 20
Cumulative Rainfall 68 170.5 407.5 444

474

482

500

604.5

739

843

869 1285
Cumulative Days Rained 7 15 26 30

36

39

42

48

58

65

72 92

2009 RAINFALL

Monthly Totals 59.5 99 14 48.5 62.5 82 0 0 21 41 24 123.5
Days Rained 8 9 7 8 6 7 0 0 3 7 5 10
Cumulative Rainfall 59.5 158.5 172.5 221 283.5 365.5 365.5 365.5 386.5 427.5 451.5 575
Cumulative Days Rained 8 17 24 32 38 45 45 45 48 55 60 70
 Date Jan Feb Mar Apr May Jun Jul Aug Sept Oct Nov Dec
1   1.5             2      
2 6                     5
3 1 2 .5  3.5 1              
4 1     3.5   .5            
5     5.5 19         8
 
9
   
6                    
3.5
(plus a beetle)
 
7         2 4         .5  
8                 11      
9                        
10    
 
.5
              3.5  
11   8   .5           1    
12   .5 .5 1                
13     2 3.5 1         .5   34
14   17  
17
          4 3.5  
15   4                    
16           8.5           30
17   1 4.5                  
18                     13  
19         10         1.5    
20    
5
    46             .5
21  
60
                  8
22     .5     .5            
23 34         19.5           1
24 1.5       2.5             1
25                        
26 2     .5   3       1    
27 13         46       24   9
28 1                      
29                       11
30                       24
31                        

2008 RAINFALL 


Monthly Totals 115.5 189 22 2.5 34 32 92 8 24.5 28 116 121.5
Days Rained 13 14 3 2 2 5 12 2 4 6 9 10
Cumulative Rainfall 115.5 304.5 326.5 329 363 395 487 495 519.5 547.5 663.5 785
Cumulative Days Rained 13 27 30 32 34 39 51 53 57 63 72 82
 Date Jan Feb Mar Apr May Jun Jul Aug Sept Oct Nov Dec
1   1       1            
2 1         11            
3 3.5 1       10            
4 10 17       5     3      
5 1.5 60         .75   12      
6   30         1   4   9 16
7   31         4         10.5
8 40         5 31       4 12.5
9                     18 14
10 1.5                 2    
11 16                 13    
12 18 11               1    
13   8                   2
14   5.5         1     2    
15                        
16 1 1.5         2     7    
17             2.75       2  
18   1.5                 6  
19       1             15  
20 1                   54  
21             5   5.5      
22 5     1.5           3    
23             3.5          
24             28          
25             11         6
26   6                   .5
27   13 3               6 .5
28 6.5   10       2 4       58
29   1.5 9               2 1.5
30         23     4        
31 11       11              


For comparison with actual rainfall, as I believe that the Sun controls the majority of our ( the whole of the Earth ) weather, below are graphs showing the changing sunspot activity.

Here is a link to the graphs as shown below.

Thanks to
NOAA/Space Weather Prediction Center

Here and here is other interesting information.


Last Updated : 28/01/2012 11:55 AM +1000